

“30×30” movements around the world are pressing national governments to ensure that 30 percent of their land masses are protected from development by 2030. The more-ambitious “Nature Needs Half” movement argues for stopping the destruction of natural habitat before the ratio falls below 50 percent (already too late for many countries).
This study examines the powerful counterforce of urban sprawl in the United States. The good news is that the rapacious rate of open space destruction of the 1980s and 1990s has slowed considerably. But urban sprawl continues to apply the chainsaw and bulldozer blades to vast amounts of rural land each year.
Between 2002 and 2017 (the period of the most recent government data), the federal Natural Resources Conservation Service identified around 17,800 square miles of new sprawl. (We use the term “sprawl” in the precise way of all our reports since 2000: “Sprawl” is the amount of rural land lost to development, regardless of its attractiveness or density.) That means 17,800 square miles of natural and agricultural land were converted during that period into developed land for residential, commercial, industrial, transportation, and other purposes.
Our study calculated that the cause of the 2002-2017 land loss fell into a surprisingly neat 2-to-1 ratio between the two overall factors of sprawl:
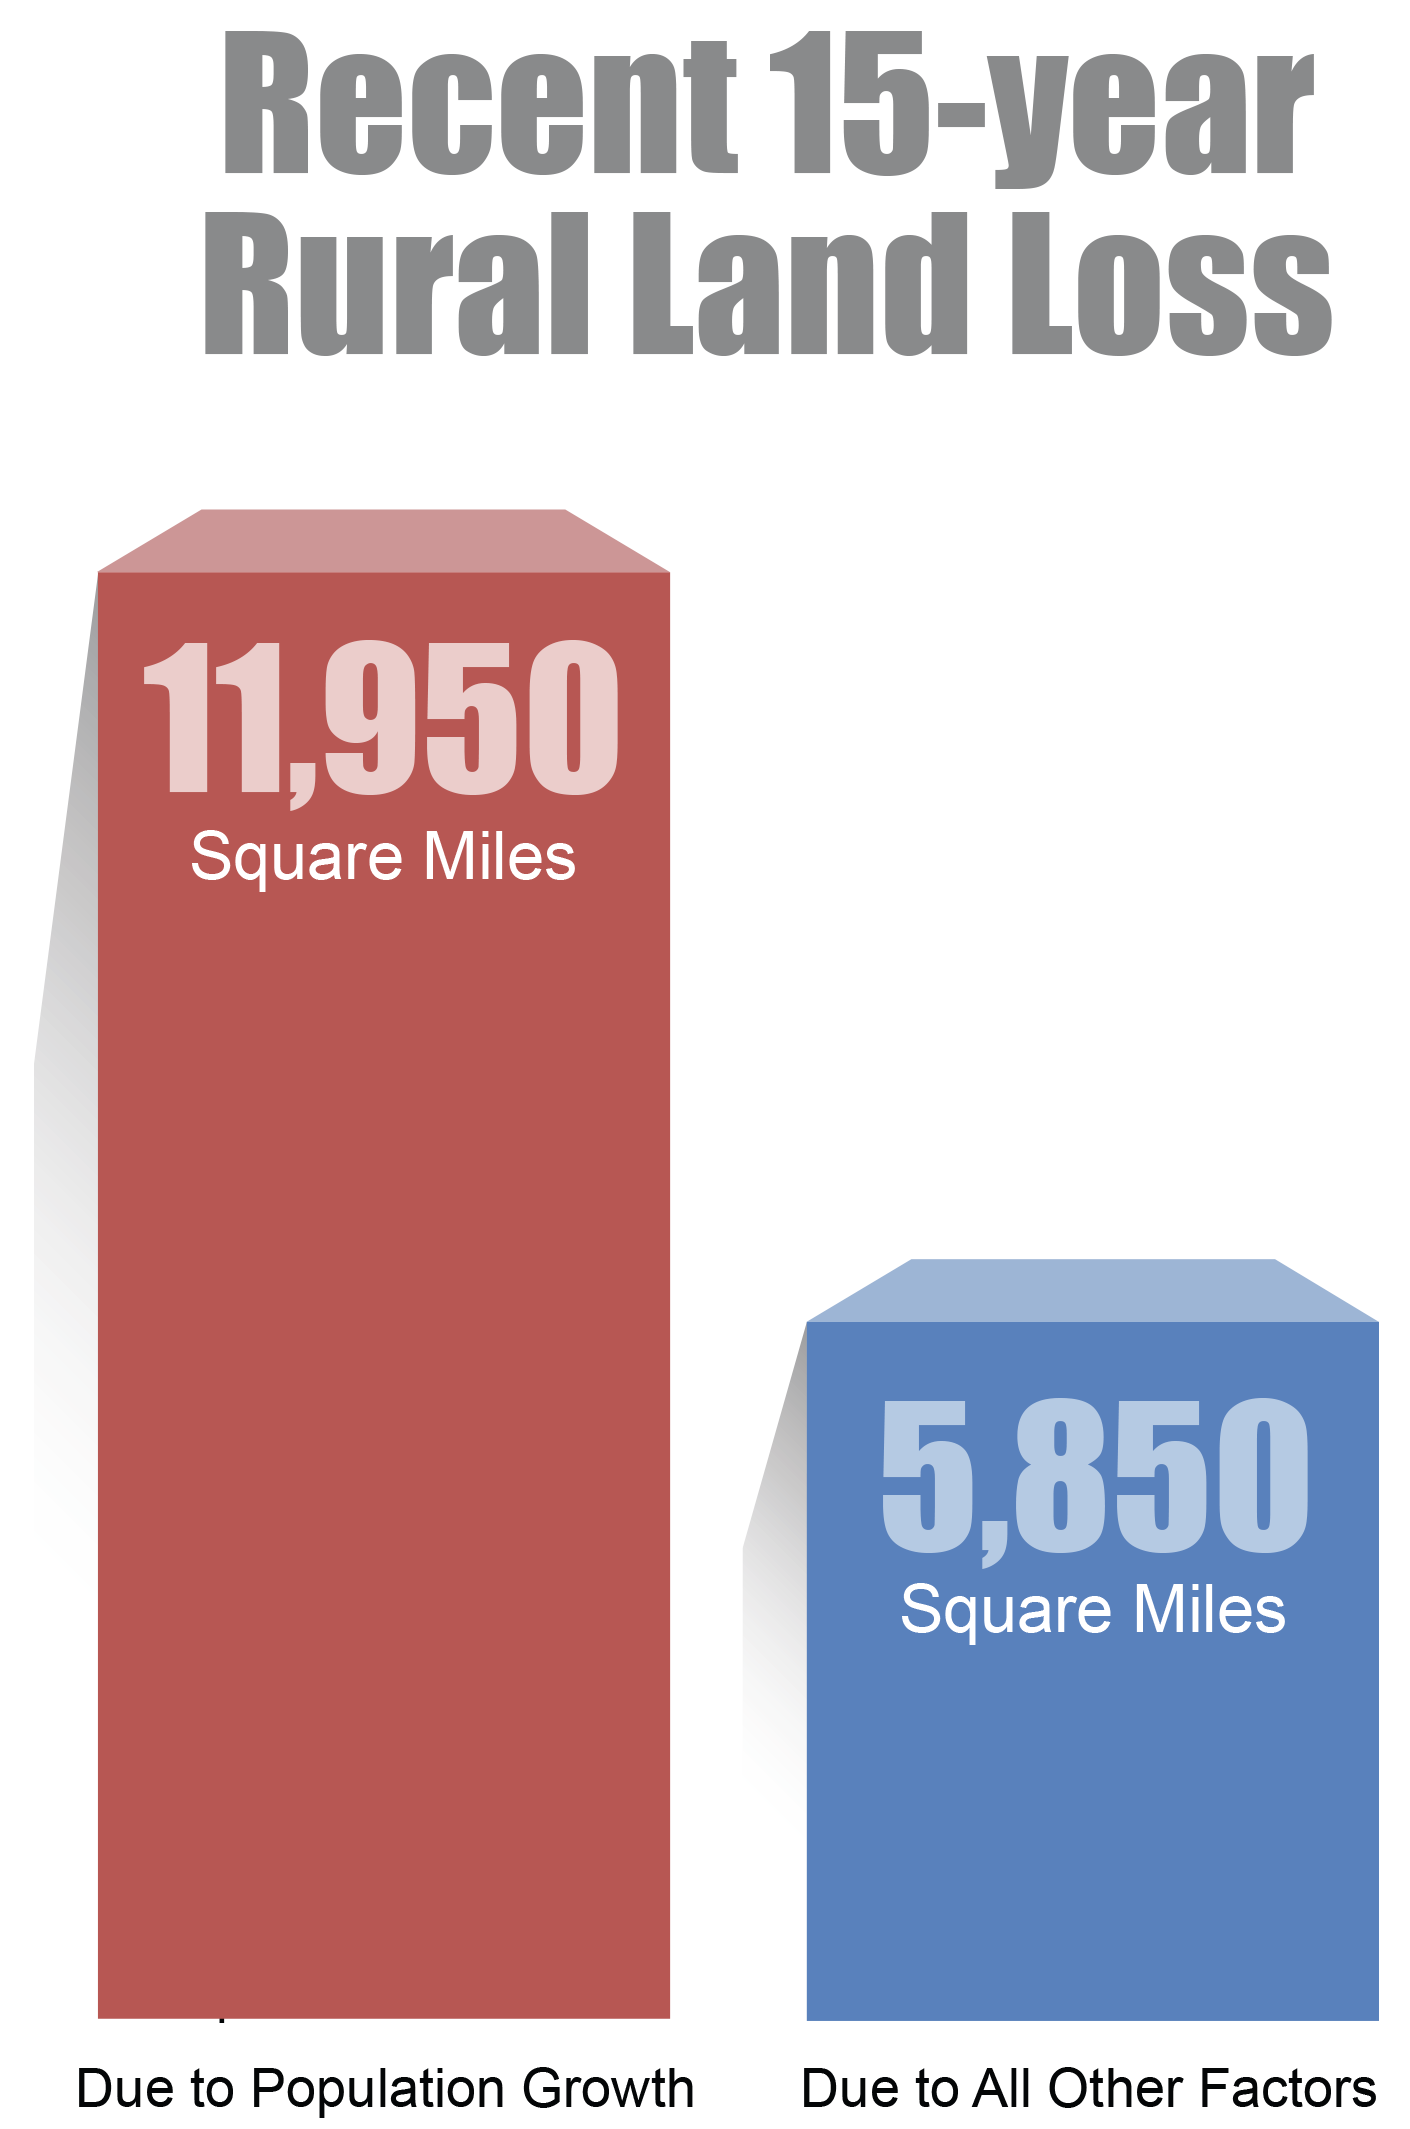
Figure ES-1. Square Miles Of National Land Loss Related To Population And To All Other Factors (2002-2017)
We also calculated rural land loss and its causes in each state (other than Alaska, which the government doesn’t include in its survey). On the map below, you can roll over any state to see the total square miles of habitat and farmland loss during the most recent 15-year period of data. You will also see a pie chart that will display the percentage of that rural land loss that is related to the state’s population growth and the percentage related to all other factors (which increase the amount of developed land per resident of the state). Twenty-six states experienced an overall decrease in developed land per resident during the recent period. That would suggest that zero percent of the land loss would be attributed to growth in per capita land consumption. However, our study found that per capita land consumption growth was a factor for at least some of the land loss in all those states because our calculations disaggregate each state’s data by county, and even states with no per capita consumption growth overall have at least some counties with growth in developed land per resident.
Figure ES-2. Land Loss In Each State And Percent Related To Each Sprawl Factor (2002-2017)
In the United States, nearly all government efforts to combat sprawl have focused on strategies which primarily seek to create denser settlement by changing land use practices.
Our findings, however, indicate that approach will have limited success in saving rural land from development because it fails to address the key reason for current sprawl – population growth and its overwhelming driver, federal immigration policies. Twenty-six states with declining development per resident in the 2002-2017 period provided case studies for that proposition.
The residents of those states lived, worked and shopped more densely than prior to 2002. How did that happen? Certainly, some role was played by so-called Smart Growth planning efforts, higher gasoline prices, fiscal and budgetary constraints (limiting new road-building, for example), the increasing popularity of denser city living (pre-Covid pandemic) and its cultural amenities, and the recession-inducing mortgage meltdown in 2008.
The extent to which any of those and still other unforeseen factors and events – such as the COVID-19 pandemic of 2020-2022 – may affect the rate of per capita sprawl in the coming decades is unknown and unpredictable. It may well be, for example, that concerns about high density residential living in the face of pandemics could increase sprawl pressures by raising the preference of consumers for lower-density suburban neighborhoods.
The 26 states with declining development per person are shown in Figure ES-3 with negative percentage numbers in green-shaded boxes. As you can see in the column next to them containing the square miles of lost rural land, all 26 states still sprawled over additional large areas of natural habitat and farmland. The population growth in these states simply erased any land-conservation benefit of denser living and better planning.
1. "Population" refers to increase in population.
2. "Consumption" refers to increase in developed land consumption per capita (per person).
Watch video for further explanation
Click and drag to move the bar chart left or right.
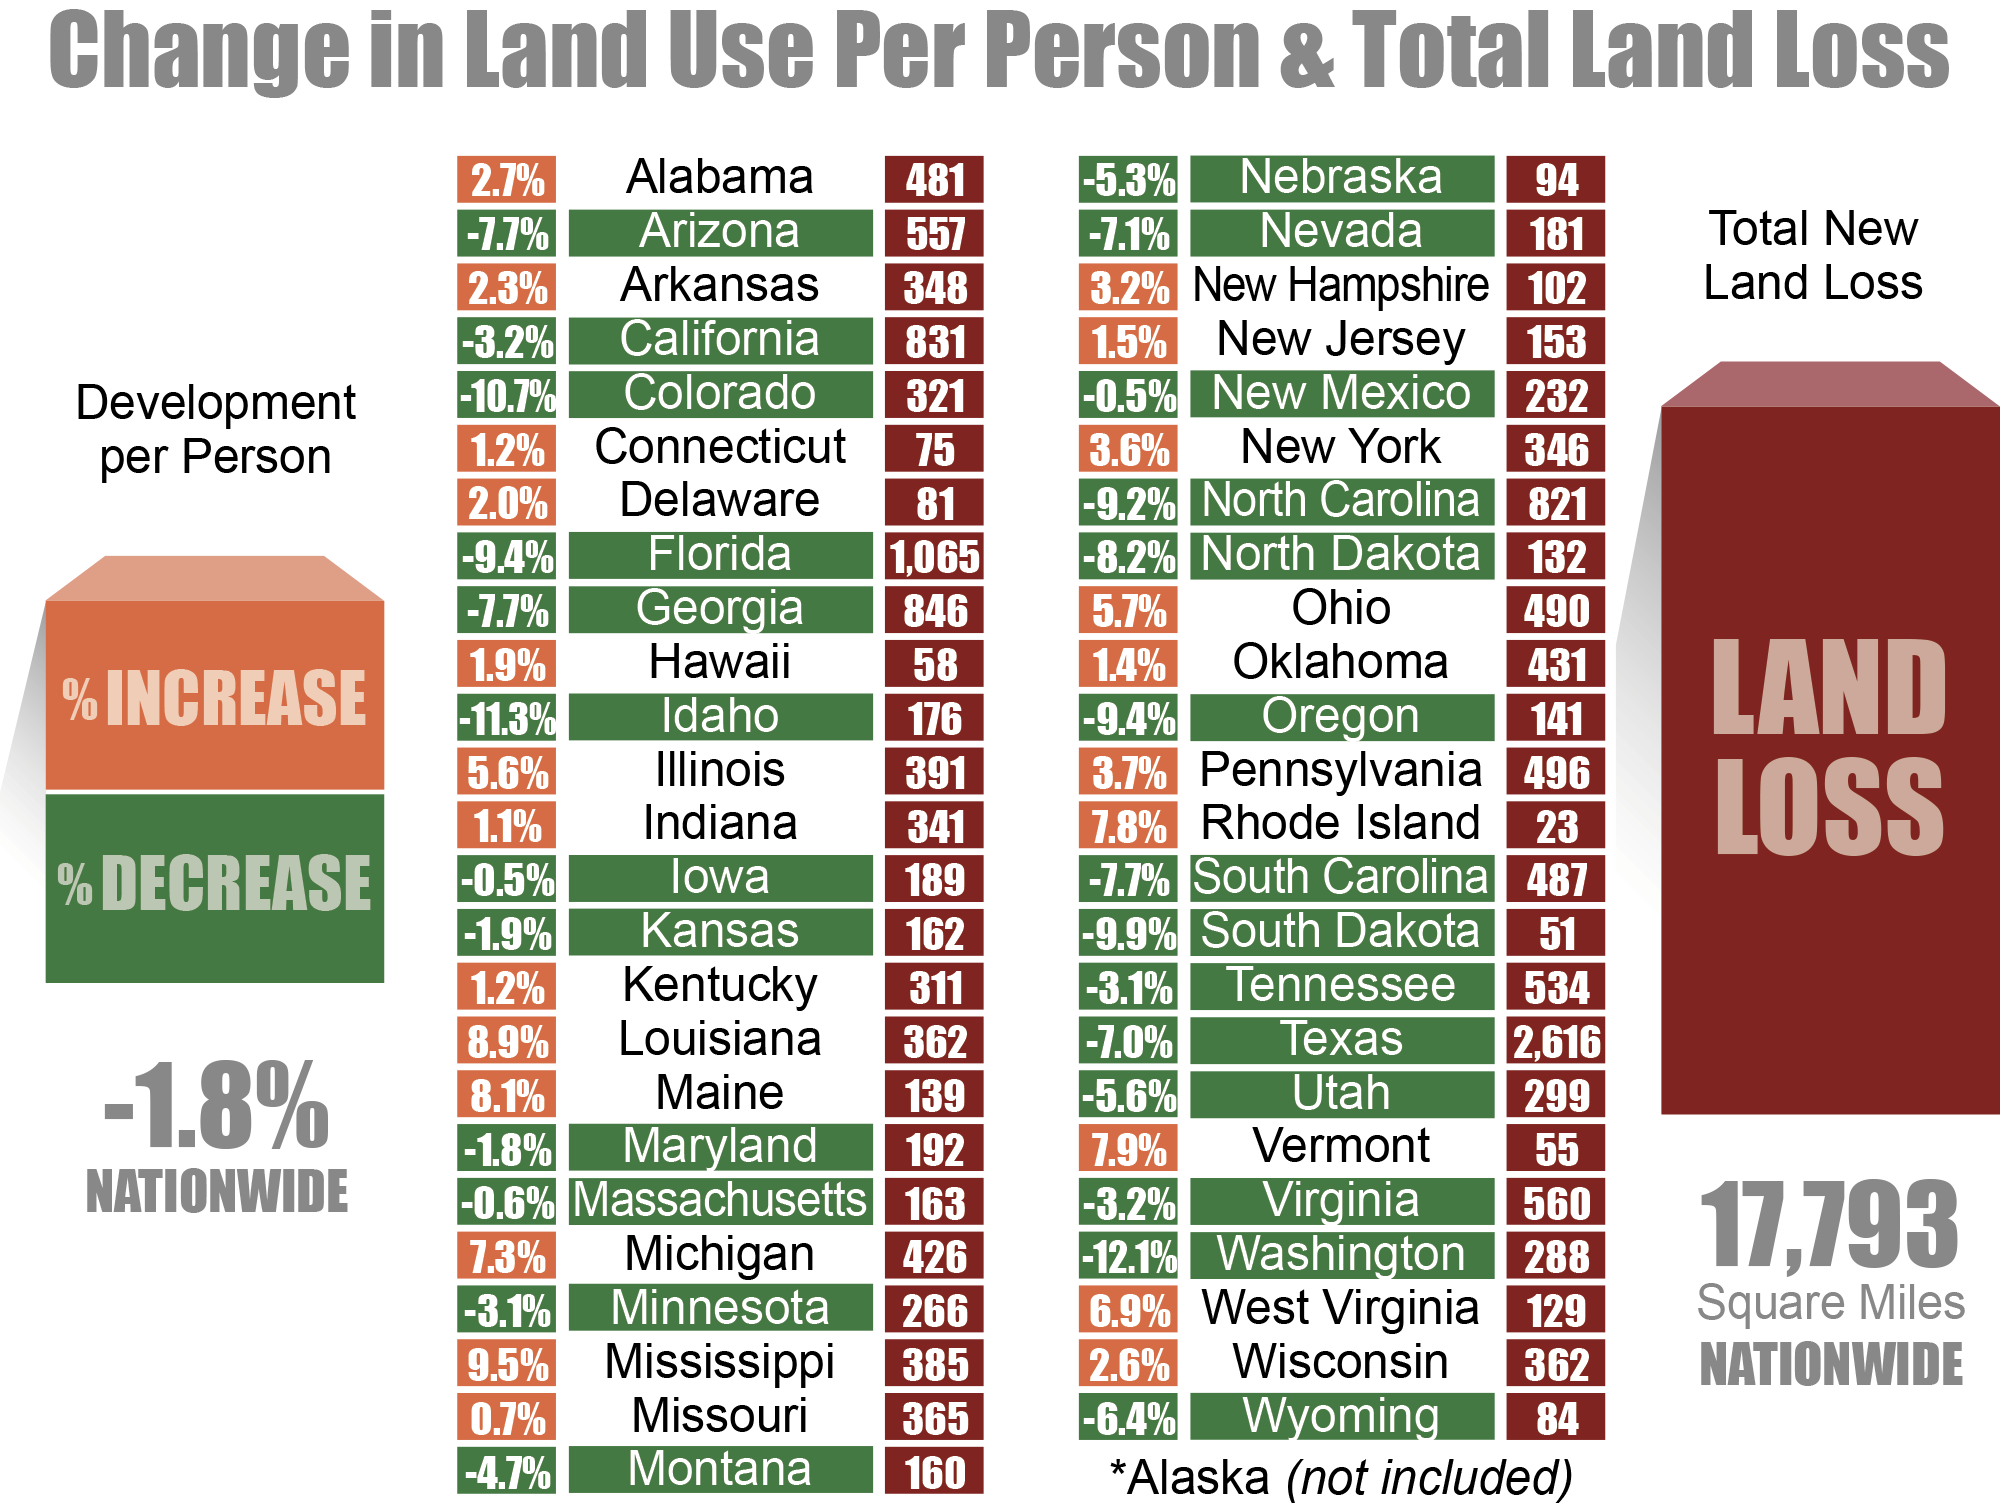
Figure ES-3. Change By State In Land Use Per Person & Total Land Loss (2002-2017)
Even if all new population could somehow be added to cities without the cities expanding over any new ground, the additional people would still greatly increase the overall ecological footprint of the cities into rural areas. For example, U.S. residents in 2017 on average used or “consumed” 0.356 acre – a little over one-third of an acre – of developed land per resident. But that 0.356-acre/resident metric does not include relatively unpopulated rural lands – farmlands (cropland, pasture, and rangeland), forests, reservoirs, and mines – that furnish crucial raw materials and products used by every consumer/resident, namely for food, fiber, fuels, water, energy, metals, and minerals. Nor does the 0.356-acre of developed land include the forestlands needed to absorb each American resident’s carbon dioxide (CO2) emissions from fossil fuel combustion to produce electricity and propel our vehicles.
All of these ecologically productive lands not covered with pavement and buildings, but used indirectly by each and every U.S. resident (and all human consumers), contribute to the average per capita ecological footprint of each American. This entails approximately 20 acres per person, according to the Global Footprint Network.
Figure ES-4. Our Ecological Footprint
One promising trend in slowing destruction of natural habitat and farmland is that U.S. population growth slowed some toward the end of the study period. Furthermore, there has been much publicity about what may have been a dramatic drop in population expansion in 2019 and 2020, although some of the data remains speculative. Both net migration and fertility rates declined, probably due in large part to the Covid pandemic. But migration rates increased rapidly in 2021, and it remains to be seen if fertility rates will rise back to pre-pandemic levels once the health crisis has subsided.
Even if the loss of habitat and farmland continues at the lower rate of the 2002-2017 period, the average destruction of 1,200 square miles per year would be unsustainable for a country that desires the continued capability of food independence and stewardship of the animal and plant life currently living within its borders.
By 2060, less than 40 years from now, the U.S. Census Bureau projects that the U.S. population will have grown from 330+ million today to 404 million Americans. This is an increase of approximately 70 million over four decades, or about 18 million per decade.
That projection is significantly less than the population expansion in previous decades. But for us as conservationists, 18 million new residents straining our natural resources and environment every decade is still a long way from the crucial goal of U.S. population stabilization established in 1996 by the President Clinton-appointed sustainability commission’s Task Force on Population and Consumption.
The almost panic-stricken reaction of pundits, politicians, and the media to news that the U.S. population grew by “only” 23 million in the 2010 to 2020 decade has led to calls from much of the American establishment to do everything in its power to postpone or try to prevent U.S. population stabilization by increasing immigration and encouraging American women to have more children.
In May 2021, the Biden Administration formally released its grand “30×30” plan in a report called “Conserving and Restoring America the Beautiful.” Co-authored by the U.S. Departments of Interior, Commerce, and Agriculture, along with the White House Council on Environmental Quality, the document characterizes itself stirringly as a “preliminary report to the National Climate Task Force recommending a ten-year, locally led campaign to conserve and restore the lands and waters upon which we all depend, and which bind us together as Americans.”
The elevated public attention to habitat preservation is a welcome change from the basic disinterest shown during most of our two decades of publishing these sprawl studies. Among many threats to wildlife, including pollution, toxics, invasive species, road mortality, overhunting, or poaching, various studies have found habitat loss is the single most critical threat to the preservation of species.
Preserving natural areas is also important for the quality of life of humans. The presence of open space within and adjacent to our urban areas – and the assurance that this open space will outlast us – serves to counterbalance the stress and strain of modern life. Contact with nature and open space provides both physiological and psychological benefits.
Nonetheless, many of the same politicians and groups who are ambitiously calling for protecting 30 percent of the United States land area from development by 2030 are also advocating large increases in immigration that would swell the U.S. population even further. Most fail to even recognize that U.S. population growth is a major factor in causing the loss of open space and natural habitat in the United States. The White House “30×30” plan, for example, does not have a single reference to U.S. population growth.
That approach doesn’t work, according to Joseph Chaimie, former director of the United Nations Population Division. Writing in early 2022 in The Hill, a favorite publication for those who work in and around Congress, he stated: “If the United States intends to address climate change, biodiversity loss, pollution, etc., it must consider how its population affects each issue.”
He lamented that federal officials for a half-century have ignored the recommendations of a bi-partisan federal commission in 1972 to stabilize the U.S. population to reduce pressures on the environment. That failure has had global demographic and environmental consequences. But the United States has a chance to redeem itself: “Gradually stabilizing America’s population will provide an exemplary model for other countries to emulate. Rather than racing to increase the size of their respective populations in a world with 8 billion humans and growing, nations would see America moving away from the unsustainable demographic strategy,” Chamie wrote.
Congress missed a similar opportunity a quarter-century ago, Gary Wockner wrote in the Las Vegas Sun. The Colorado-based, self-proclaimed “river warrior” recognized for efforts to save wild waterways in many countries decried the failure of federal officials to heed the conclusion in 1996 of President Clinton’s Task Force on Population and Consumption that U.S. population stabilization is essential for environmental sustainability. “Time is running out, but we can make sure the next three decades don’t mirror the past 30 years of population growth and environmental destruction,” he wrote. “President Joe Biden has an opportunity to follow in Clinton’s footsteps and finally implement the council’s recommendations. Our most pristine and breathtaking places are worth protecting. But we won’t be able to save them if our country keeps growing by leaps and bounds.”
At the time of the report, the U.S. population had exceeded 281 million. The task force warned that if the country did not heed its recommendations, “U.S. population is likely to reach 350 million by the year 2030; a level that would place even greater strain on our ability to increase prosperity, clean up pollution, alleviate congestion, manage sprawl, and reduce the overall consumption of resources.”
Unfortunately, the task force’s dismal warning is turning out to be largely precise. U.S. population has already exceeded 332 million in 2022 and is headed for 355 million by 2030, according to the Census Bureau. The imperiled natural habitat, species, and human communities are reviewed in the opening chapters of our study.
Today’s urgent national efforts, such as the 30×30 movement, are based on changing the trajectory of open-space loss by 2030 without changing the trajectory of population growth. Echoing the conclusions of the Clinton task force, our latest national sprawl study finds that formula is highly unlikely to be successful.
The outlook for open-space conservation could be much more positive, however, if Congress simply would follow the Clinton task force recommendation to adopt annual immigration numerical caps consistent with the goal of stabilizing the country’s population size.